Cumulative Delta vs Volume Delta: what pros actually watch
Two tools, related name, different job. Volume Delta is a per-bar measurement. Cumulative Delta is a running story about who has been winning the session. Here is when each matters, and when neither does.
Two of the questions that come up most in our Discord: “is cumulative delta different from volume delta?” and, one hour later, “which one should I use?”
Short answer: they are different measurements of the same underlying thing (signed volume from aggressive orders), and the better question is when to look at one versus the other. Most of the time, you want both, on the same chart.
The measurements
Both start with the same tick-level classification. Each trade gets tagged by which side was aggressive:
- Trade printed at the ask, buyer was aggressor,
+volume. - Trade printed at the bid, seller was aggressor,
-volume. - Trades printed between bid and ask are usually tagged by the last-tick rule, or thrown out if the feed supports it.
Sum those signed trade sizes over a bar and you have Volume Delta. It is a single number per bar: “net aggression during this bar.” Positive means buyers leaned harder, negative means sellers did.
Sum volume delta across every bar of the session (or whatever anchor you pick) and you have Cumulative Delta. A running score of net aggression since the session started.
So cumulative delta is just the integral of volume delta. Same raw input, different view.
What each one is good for
Because they are the same data integrated over different windows, they answer different questions.
| Question you are asking | Tool that answers it |
|---|---|
| Did this specific bar show aggressive buying or selling? | Volume Delta |
| Is the bar’s close at the top of its range on positive delta? (buying that held) | Volume Delta + bar structure |
| Who has been winning the session so far? | Cumulative Delta |
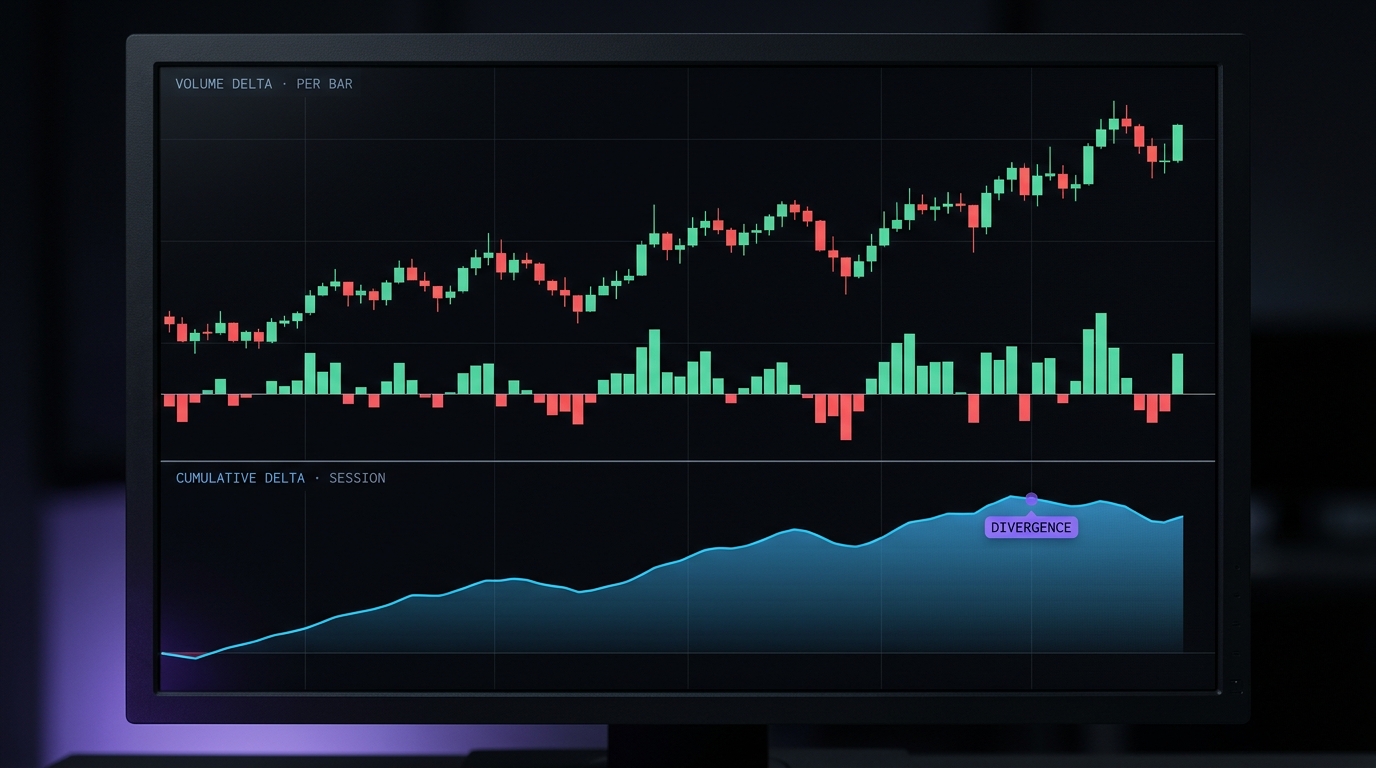
| Is price making a new high while delta is not? (divergence) | Cumulative Delta |
| Is absorption happening at this level? | Both, plus price response |
| Should I front-run a breakout? | Neither (use context, not raw delta) |
The last row matters. Both tools are diagnostics, not signals. Cumulative delta that has been grinding higher does not predict a breakout. It describes the state of the tape up to this bar. If you treat it like a leading indicator you will get stopped a lot.
Where the confusion comes from
Two reasons traders mix them up.
First, most charting platforms ship one and call it the other. TradingView’s built-in “Cumulative Volume Delta” is actually cumulative. Sierra Chart has multiple studies named similarly that do different things. NinjaTrader has both VolumeDelta and a separate CumulativeDelta and they are not substitutable. Read the documentation before you trust the label.
Second, the visual presentation is similar. A histogram of volume delta and a line of cumulative delta both go up and down in sympathy with order flow, and on a five minute chart they rhyme. But they diverge sharply in choppy sessions, because cumulative delta has memory and volume delta does not.
Divergence is not what you think
The single most repeated claim about cumulative delta is that divergence between price and delta predicts reversals. This is half true in a way that matters. Real absorption shows up as cumulative delta continuing to rise while price refuses to follow, because passive sellers are eating the aggressive buying at a level. The chart shows a wall, cumulative delta shows enthusiasm, and eventually the buyers exhaust. That is a real setup.
But cumulative delta lagging a move is also what happens when the move is driven by passive-side trades or large orders posted at the ask that sweep through resting bids. The tape can get moved with low net delta when the players do not care about being caught by a footprint study. So treat divergence as a hypothesis about who is present, not a trigger.
Practical setups
A few high-utility ways we see cumulative and volume delta used together in live trading:
- Session open bias. The sign of cumulative delta in the first 15 minutes of RTH often locks in the tape’s early bias. It is not a trade signal, it is a who is in charge read.
- Failed breakout detection. Price punches through a prior high, volume delta on the breakout bar is negative, cumulative delta stalls or rolls over. The move is being sold into.
- Absorption at a known level. VPOC or VWAP. Price tests the level, cumulative delta keeps pushing in one direction, price holds. The level is being defended passively.
In every one of those, you are not trading the delta, you are using it to weigh evidence about what price is doing.
Buyers keep pressing. Price refuses. Someone passive is on the other side.
One last thing
If your delta indicator resets at midnight UTC instead of at your cash session open, your cumulative reading is meaningless for RTH trading. Session-aware reset is table stakes. We learned this the hard way reviewing vendor code (a lot of it just uses Time[0].Hour == 0) which produces a reset at the wrong time depending on the user’s time zone and the underlying session definition.
The QuantForged Cumulative Delta and volume delta both hook into NinjaTrader’s session iterator directly, so a reset happens when the session actually rolls, not when a wall clock flips. The boring details matter more than the pretty colors.